Data Analysis With Python
In this project we will be using the programming language python and its associated libraries, the famous pandas to analyse our data and jupyter notebook .Preliquisites of are a basic understanding in statistics and python. Python is one of the powerfull tools used in data science, Machine and Artificial Intelligence(AI)
Project description
Rocry Shopping Company is an e-commerce company based in Diwali, India. The sales data has been extracted from the company’s website for this analysis.
Project requirements
- Delete the empty columns (Status and unnamed1)
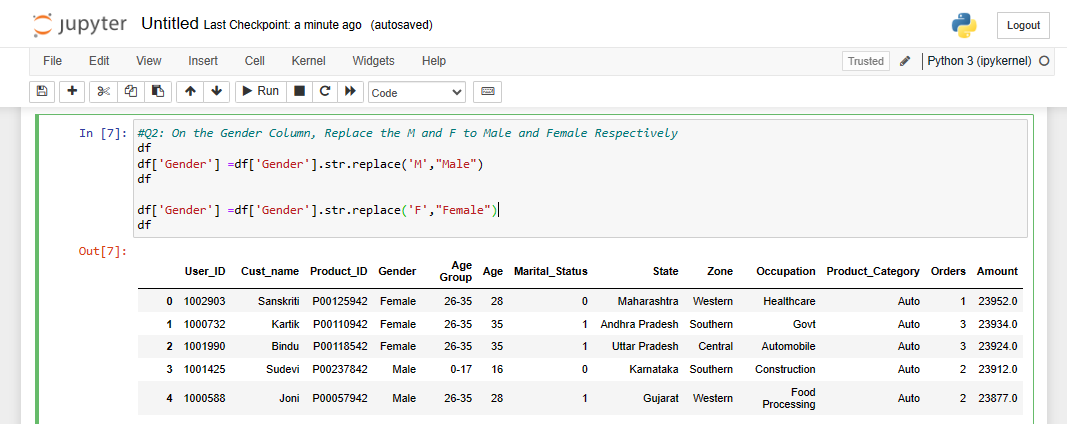
- On the Gender Column, Replace the M and F to Male and Female Respectively
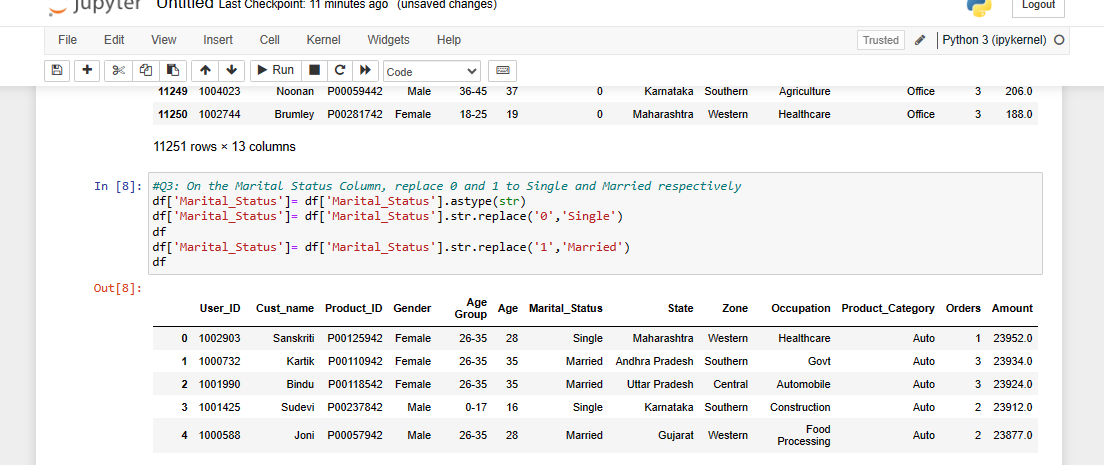
- On the Marital Status Column, replace 0 and 1 to Single and Married respectively Some Orders were Unsuccessful i.e., incomplete. They are the ones with empty records in the Amount Columns.
- Replace such empty cells with 0
- Total number of Customers
- What Occupation placed the highest numbers of Orders and by what Sum of Orders
- The Top 10 Product_Category by Sum of Amount and the corresponding percentage of total
- What Age Group of Male and Female respectively placed the highest number of Orders
- What do you observe from your answer to Question 9
- Sales by States across the Gender
Using appropriate skill get the following information
Lets begin by loading our data in pandas
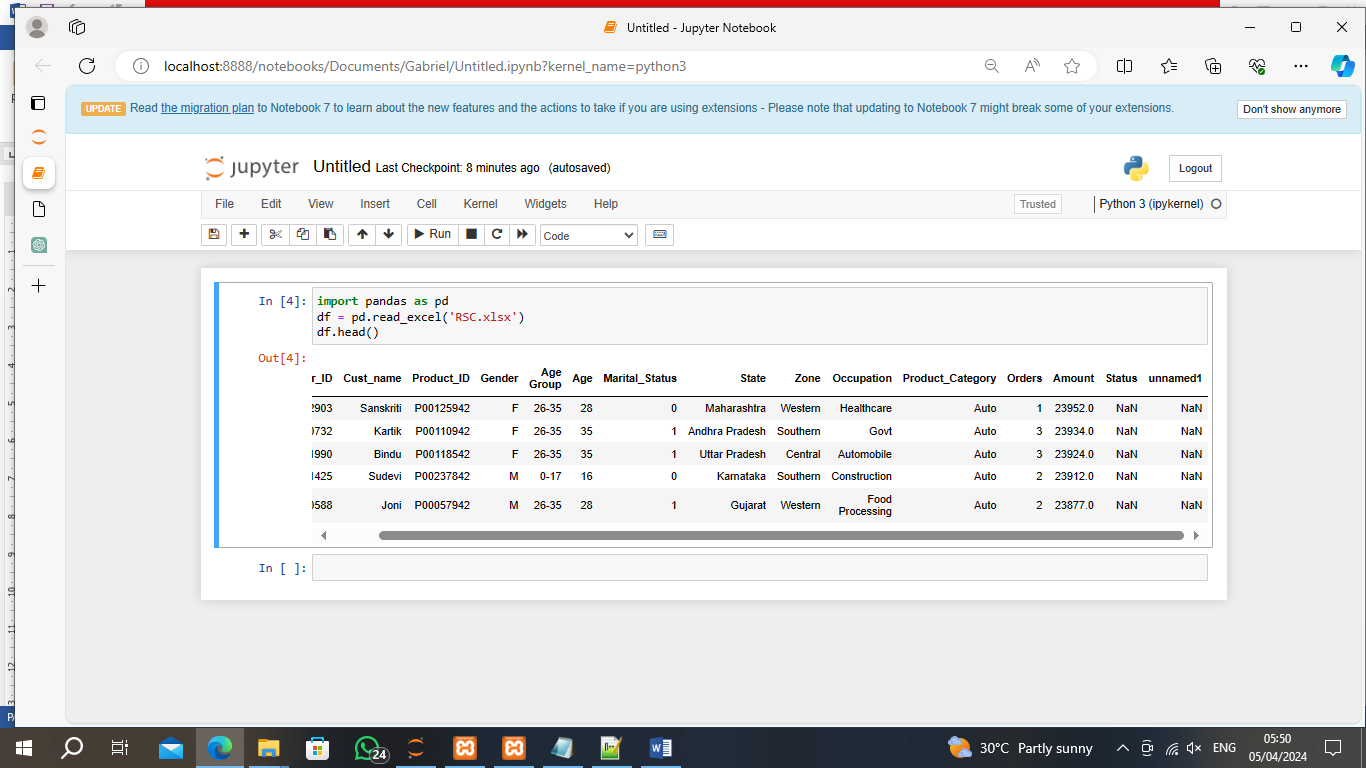
1. Delete the empty columns (Status and unnamed1)

Output
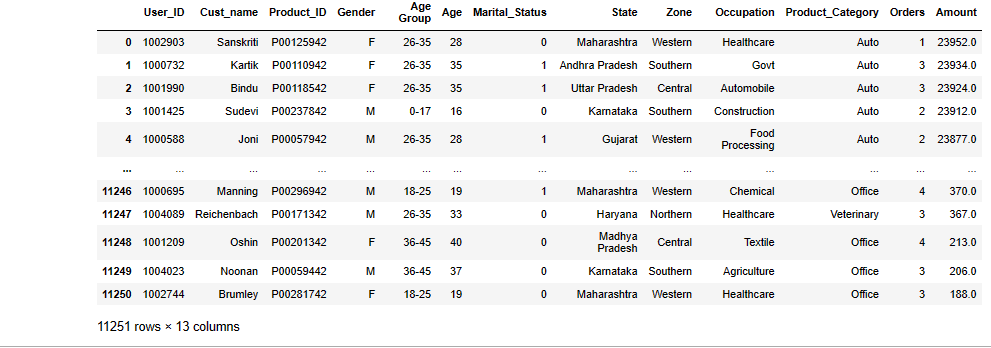
2. On the Gender Column, Replace the M and F to Male and Female Respectively
3.On the Marital Status Column, replace 0 and 1 to Single and Married respectively
4. Replace such empty cells with 0
Using appropriate skill get the following information
5. Total number of Customers

6. What Occupation placed the highest numbers of Orders and by what Sum of Orders

From the table above, we can see that the IT sector recorded the highest number of Orders by 4010.
7. The Top 10 Product_Category by Sum of Amount and the corresponding percentage of total.
Code

Output

8. What Age Group of Male and Female respectively placed the highest number of Orders
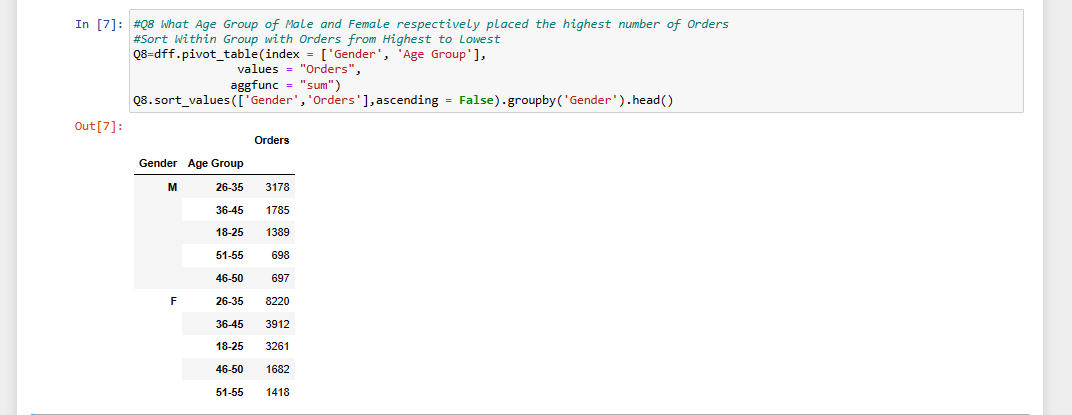
9. What do you observe from your answer to Question 8? the first three group age are same for both genders.
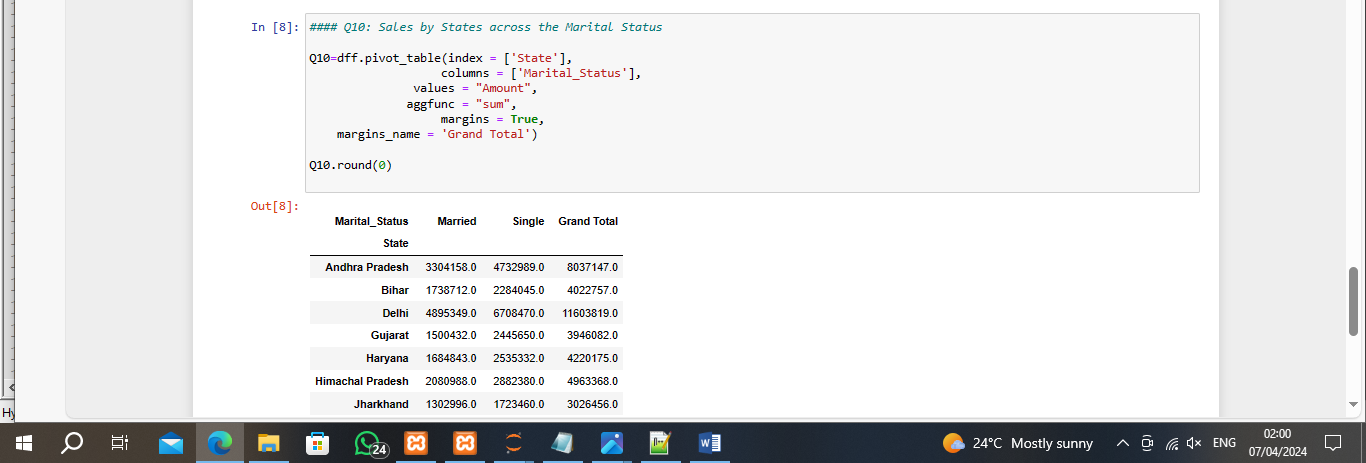
10. Sales by States across Marital Status
THE END
Stay tuned for more posts data analysis/science projects and tips using python,excel and SQL.